EARTfelt Greetings, dear friends of protection and control engineering, today we show you how to verify measured Analog Signals and Sampled Values within a Digital Substation. To face this challenge, we are going to use the brand new tool "EnerLyzer Live", a real time measurement and recording system coming up with Omicrons new CMC 430.
Within our example a hybrid measurement setup with simultaneous measurements of analog values, IEC 61850-9-2 Sampled Values and IEC 61850 GOOSE in parallel will be shown. Therefore a measurement at a protection relay of a power transformer with digital connection to the protection relay should be done.
Connecting the Test Set for Hybrid Measurement 110 kV / 10 kV
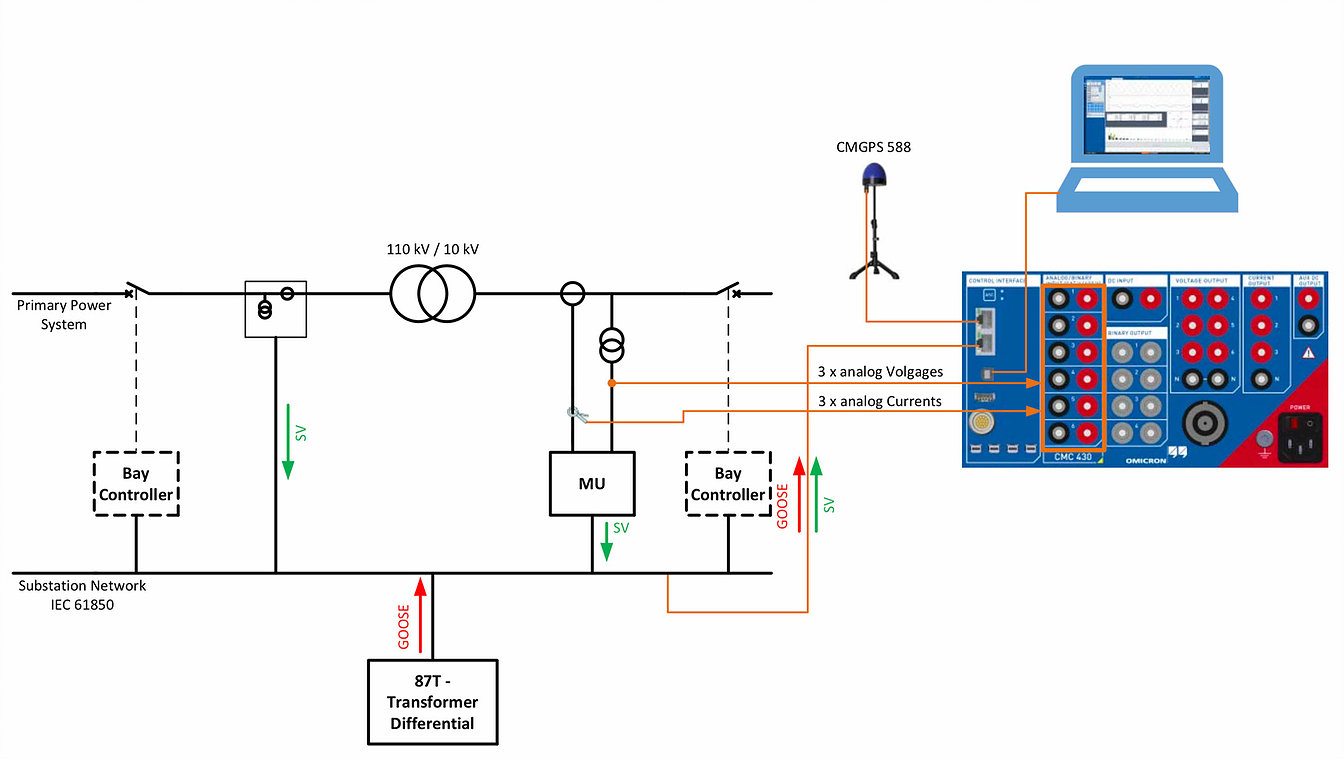
The power transformer is 110 kV / 10 kV with rated currents of 250 A primary and 2500 A secondary. On the high voltage side non-conventional VTs/CTs are used, which deliver voltages and currents measurements to the relay with IEC 61850-9-2 Sampled Values. On the secondary side a merging unit is used which converts secondary values from conventional VTs (10 kV / 100 V) and CTs (2500 A / 1 A) to Sampled Values (shown as primary values). The relay sends trip and pickup (start) information as IEC 61850 GOOSE messages over the process bus network.
Using EnerLyzer Live, all signals, the hard-wired analog voltages and currents injected into the merging unit, the Sampled Values from the merging unit on the secondary side and the Sampled Values of the non- conventional VTs/CTs on the primary side can be measured simultaneously. Sampled values of 61850-9-2 are timed at the measuring source of the stream and are aligned to the absolute time of a reference clock. For precise measurements of Sampled Values from different sources in a hybrid scenario, the CMC has to be synchronized to an absolute time reference, so that the phase angles between the different Sampled Values streams and measured analog values are exact.
Set-up EnerLyzer Live
For the measurement of conventional analog voltages and currents the settings are done as shown in the following figure:
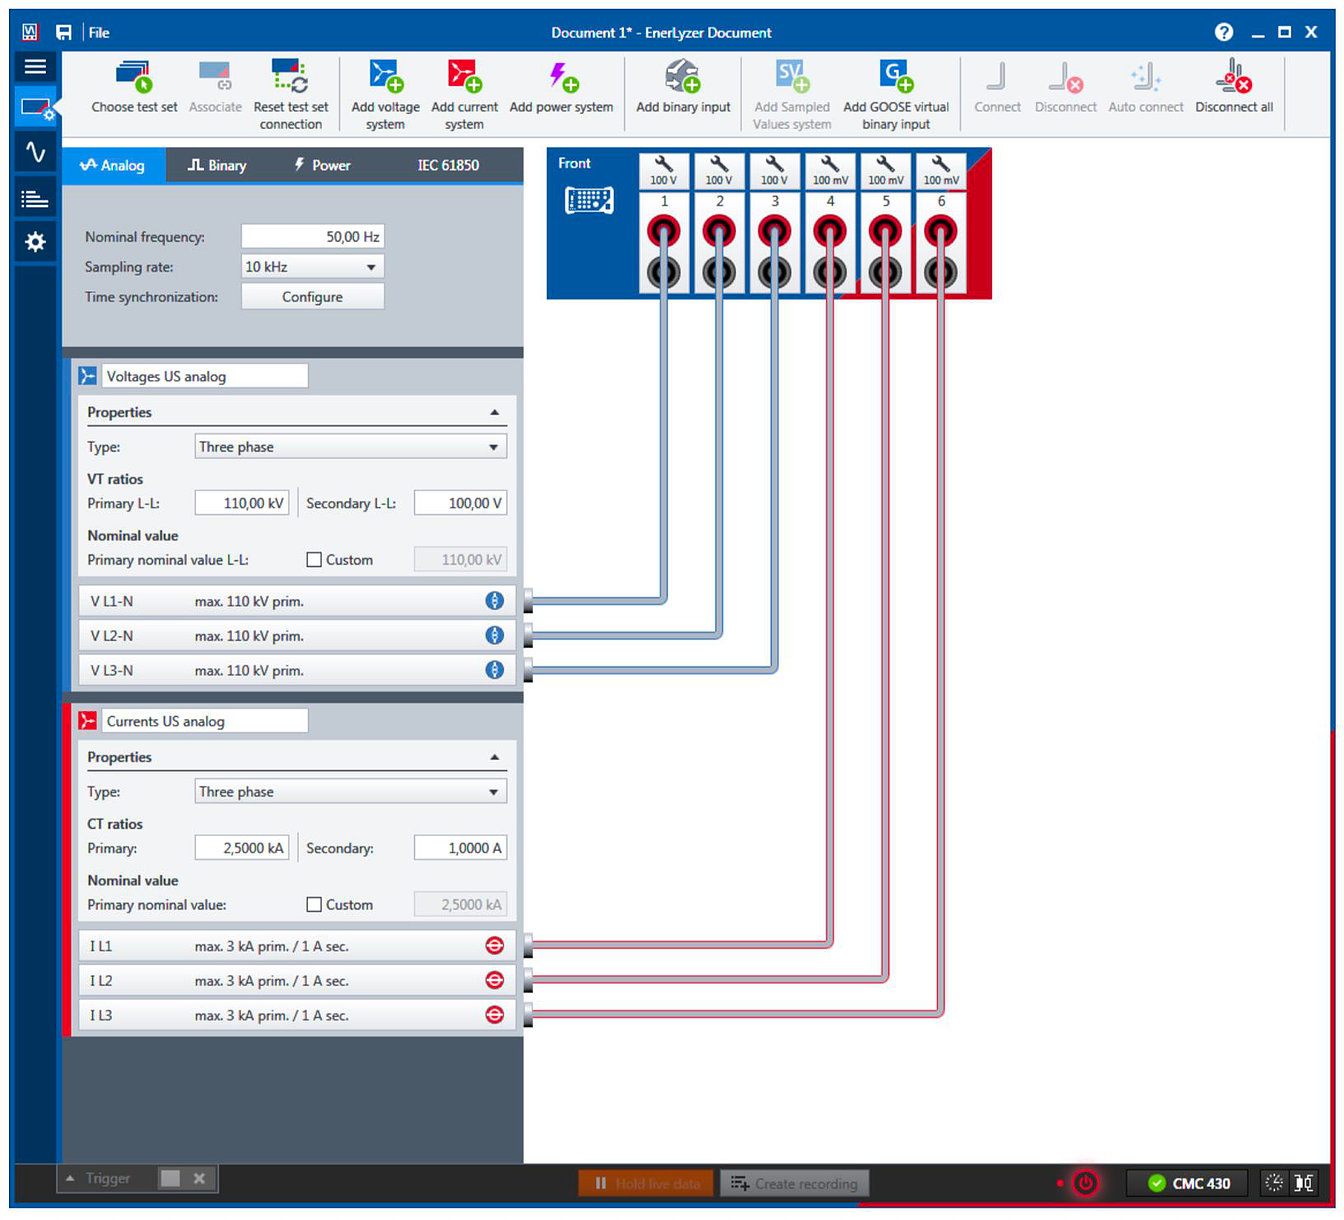
There is one three phase voltage system connected to the first 3 multi-purpose inputs directly and one three phase current system connected to the next 3 multi-purpose inputs using shunt resistors.
For measuring binary signals from GOOSE on the network, first the GOOSE have to be configured using the Test Universe GOOSE Configuration test module. Within the GOOSE Configuration test module the mapping between data attributes in subscribed GOOSE messages to virtual binary inputs has to be done. Therefore you have to add a virtual input group in the hardware configuration of the GOOSE Configuration test module.
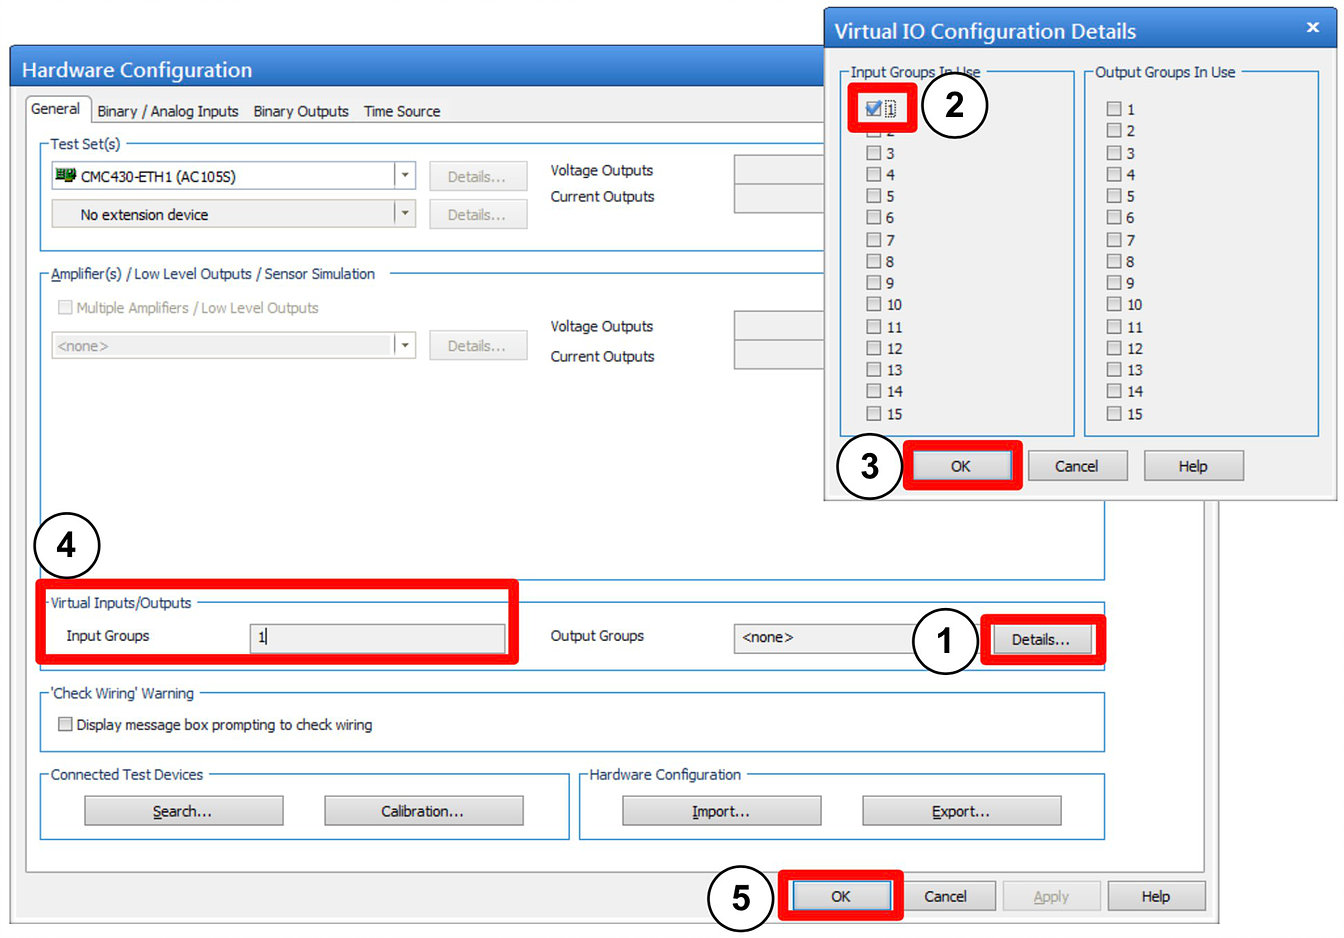
1. Click Details: Virtual IO Configuration Details dialog opens
2. Add the virtual input group 1
3. Click OK
4. Defined virtual input groups are listed here
5. Click OK to apply the settings
Next, the mapping from GOOSE data attributes to virtual binary inputs has to be defined. The structure of the data set used for the specific GOOSE messages can be defined within the GOOSE Configuration test module either manually or by importing from a SCL file (Import SCL) under the Subscription tab. Individual data attributes from within the data set (mostly Boolean values) can be mapped to virtual binary inputs as follows:
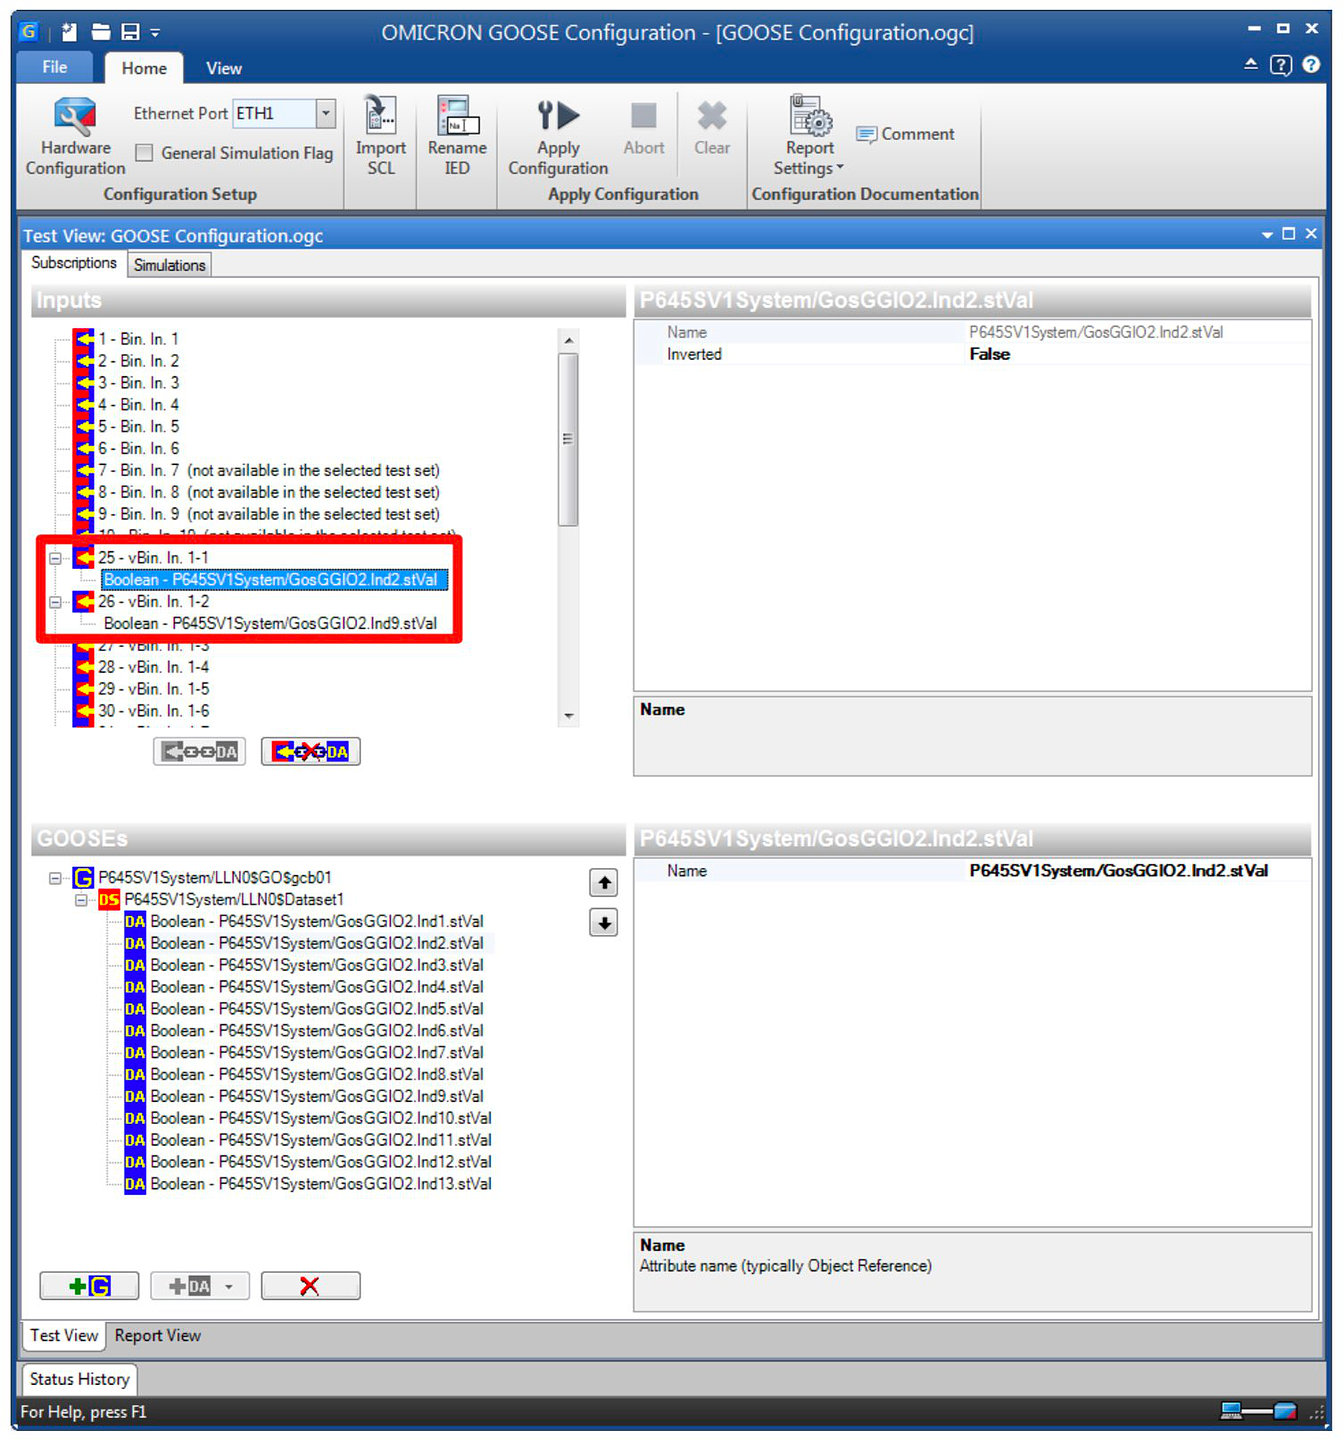
The group and input index of the mapped virtual binary inputs are important because they have to be configured in EnerLyzer Live accordingly. The CMC has to be configured for GOOSE subscription by applying configuration within the GOOSE Configuration test module. Therefore click Apply Configuration in the GOOSE Configuration test module.
Within EnerLyzer Live now you can create GOOSE virtual binary inputs, by setting the corresponding group and input number. The input group and the input numbers of the defined virtual inputs in the GOOSE Configuration module have to be the same in EnerLyzer Live.
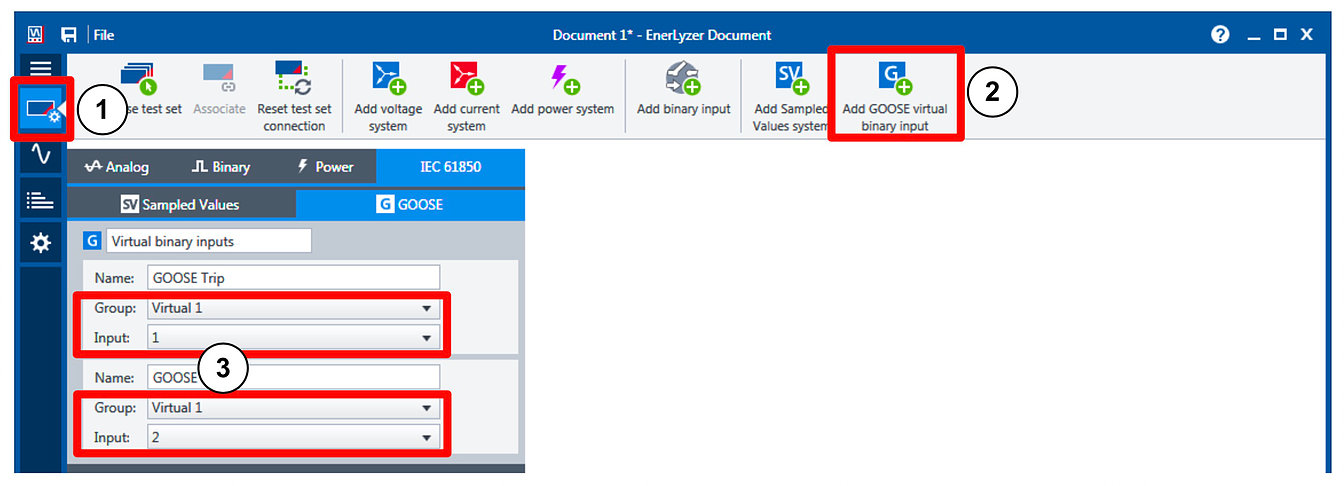
1. Go to Test set configuration within EnerLyzer Live.
2. Click Add GOOSE virtual binary input
3. Choose input group and input number accordingly.
To configure measurement of Sampled Value stream within EnerLyzer Live add one Sampled Values streams for the low voltage (LV) and another one for the high voltage (HV) side. On the Sampled Values tab you have to configure the streams with its Sampled Values ID, Multicast MAC address and Sampling rate. Additionally you have to choose the Ethernetport of the CMC, where the network streams should be received.
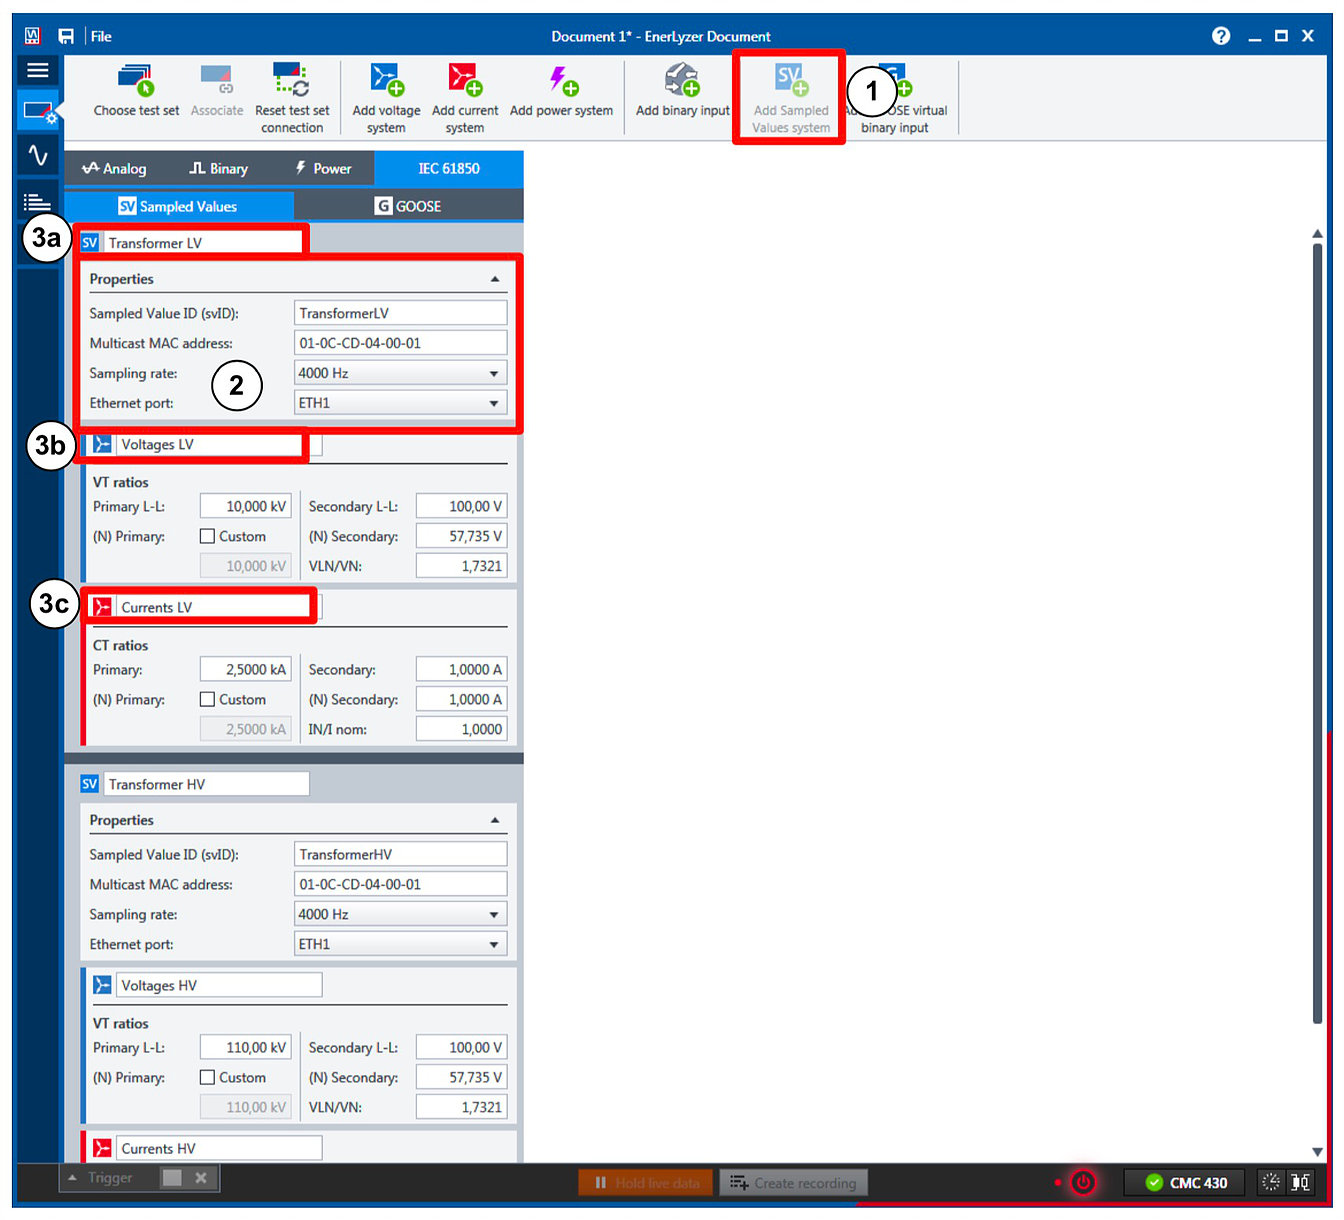
1. Click Add Sampled Values system: The Sampled Values tab opens and a Sampled Values system appears.
2. Configure Sampled Values ID, MAC address and the Sampling rate of the stream to be captured accordingly
3. Give the Sampled Values system, the voltage and current system within the Sampled Values system a proper name to be able to distinguish the measurements later on.
For the rated values you set the primary nominal values according to the rated values in the Sampled Values stream. For secondary nominal values you can choose values suitable to compare the values with other secondary values. E.g. for the LV-side the same secondary nominals as the ones injected secondary into the merging unit are used. For the values from the non-conventional instruments transformers on the HV-side any arbitrary secondary nominals can be set.
Before starting the measurement, you have to establish time synchronization for the CMC test set. The CMC has to be connected to a time reference. Preferably you can connect an OMICRON CMGPS 588 to the second Ethernet port of the CMC. If no other test module from Test Universe did setup the time synchronization, you have to do this in EnerLyzer Liveexplicitly. There is a different status indicator in the status bar where the online status of the CMC test set is shown in EnerLyzer Live. The simple online status is shown if the test set is not synchronized yet.
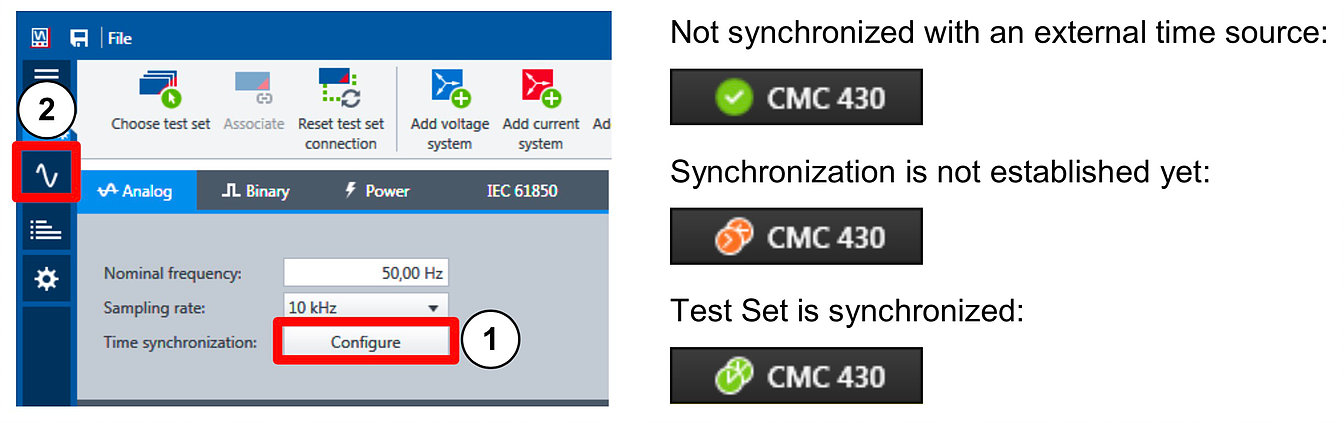
1. Click Configure within the Analog tab in the Test set configuration to configure the connected time source.
2. Click on signal pool to apply all configurations to the cmc test set and to start the measurement.
Analysis of measurement
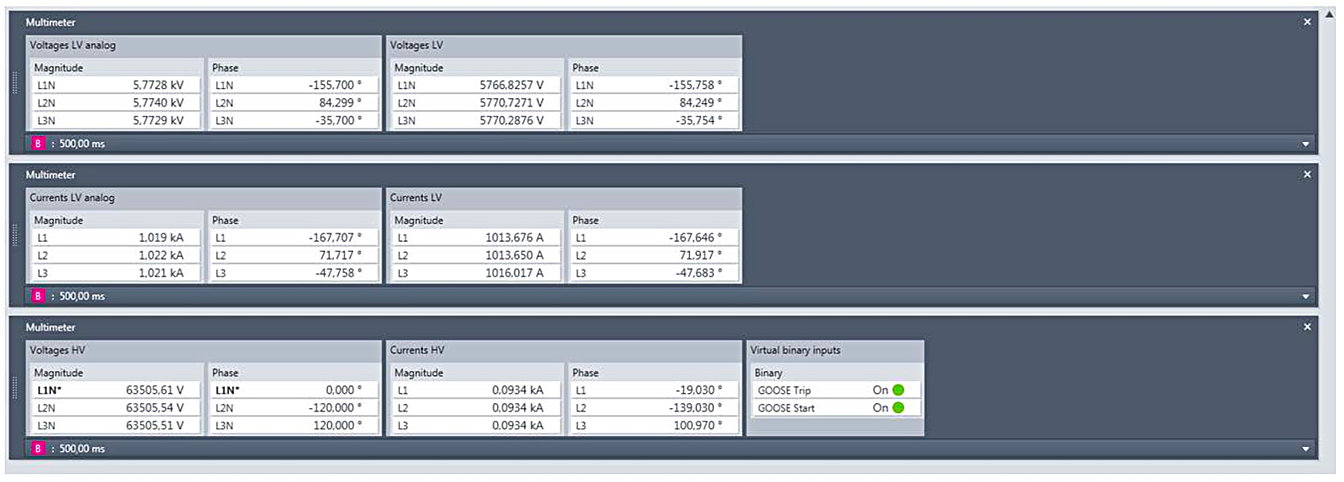
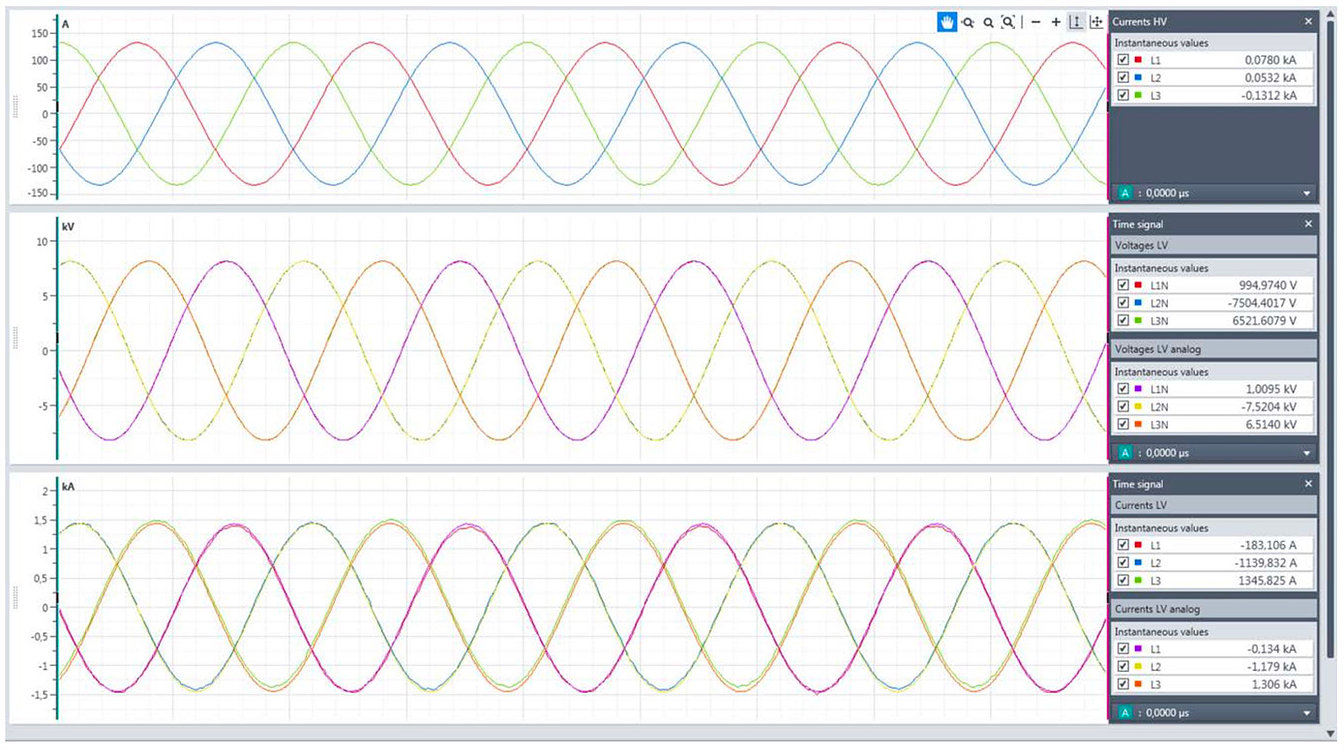
The measurement values of two Sampled Values streams, of the analog measurements and status of the captured GOOSE messages are shown in the multimeter view. The different voltage and current systems should be represented in magnitude and with the corresponding phase angles. Therefore phasor measurements are chosen form the signal pool.
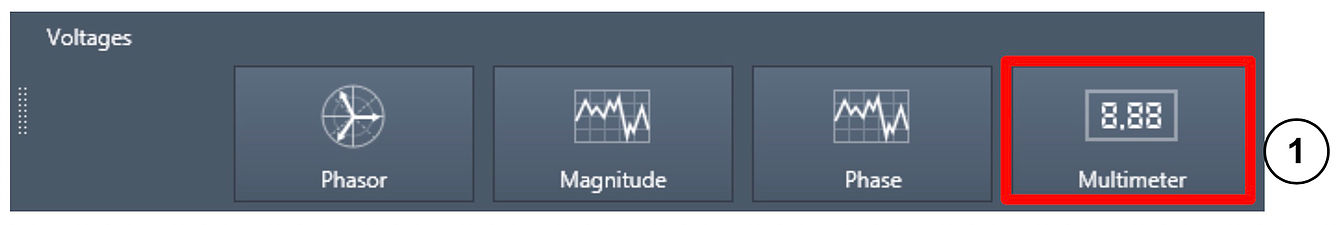
1. Click Multimeter to represent magnitude and phase angles in numerical values.
The following figure shows the dashboard with all measured signals in the Multimeter view.
A convenient way to see the relation between the measured signals and their phase angles is displaying the measured systems as a phasor diagram.
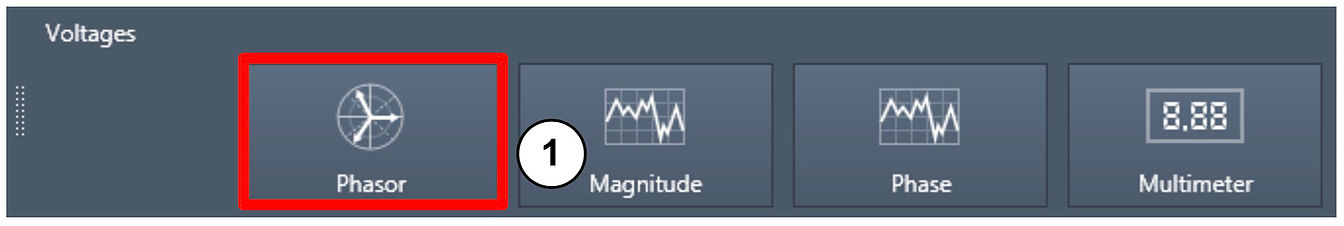
1. Click Phasor to represent the measured voltage and current systems as phasors.
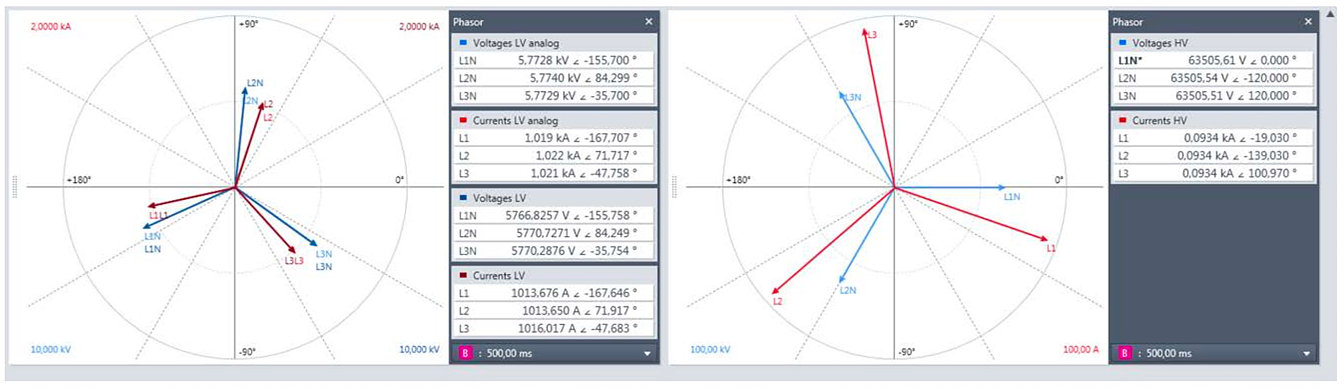
Note: Up to four systems can be represented within one phasor diagram. Voltage, current or/and power systems can be represented as phasors.
For the phase angle values it is convenient to set one signal as the reference phase, which will indicate a phase angle value of 0 °. A reference signal can be chosen in the Settings pane.
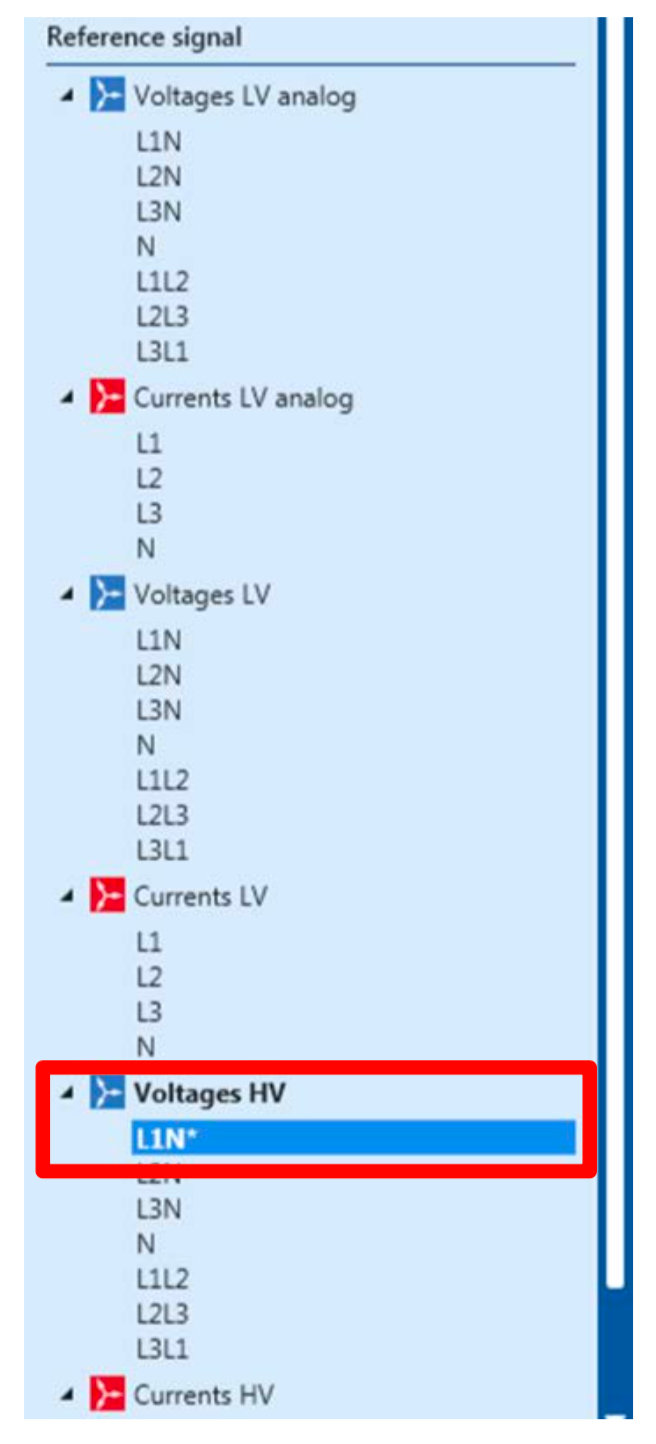
Now the L1 voltage from the HV-side is the reference signal with a phase angle of 0 °. This can be seen in the phasor diagram above. The current reference signal is indicated with an asterisk (*) in the legend of the widgets.
For a more detailed analysis of sampled signals you can use the time signal views too. You can put instantaneous signals for both analog measured and Sampled Values into the same time signal widget. If everything is working correctly, all the signals from analog and digital sources should be aligned as shown in the following figure:
Detailed investigations can be done easily within the live data stream of the measured signals. For this just click Holdlivedata in the status bar.

Note: When EnerLyzer Live is in “Hold” the data represented in the dashboard is “frozen” but the measurement in the background still continues.
If the hybrid measurement is setup correctly, you can start investigating and recording more detailed scenarios. E.g. a recording for an evolving fault on the transformer can be recorded together with the reaction of the protection relay, which is seen as trip and start signals on GOOSE messages from the protection relay.
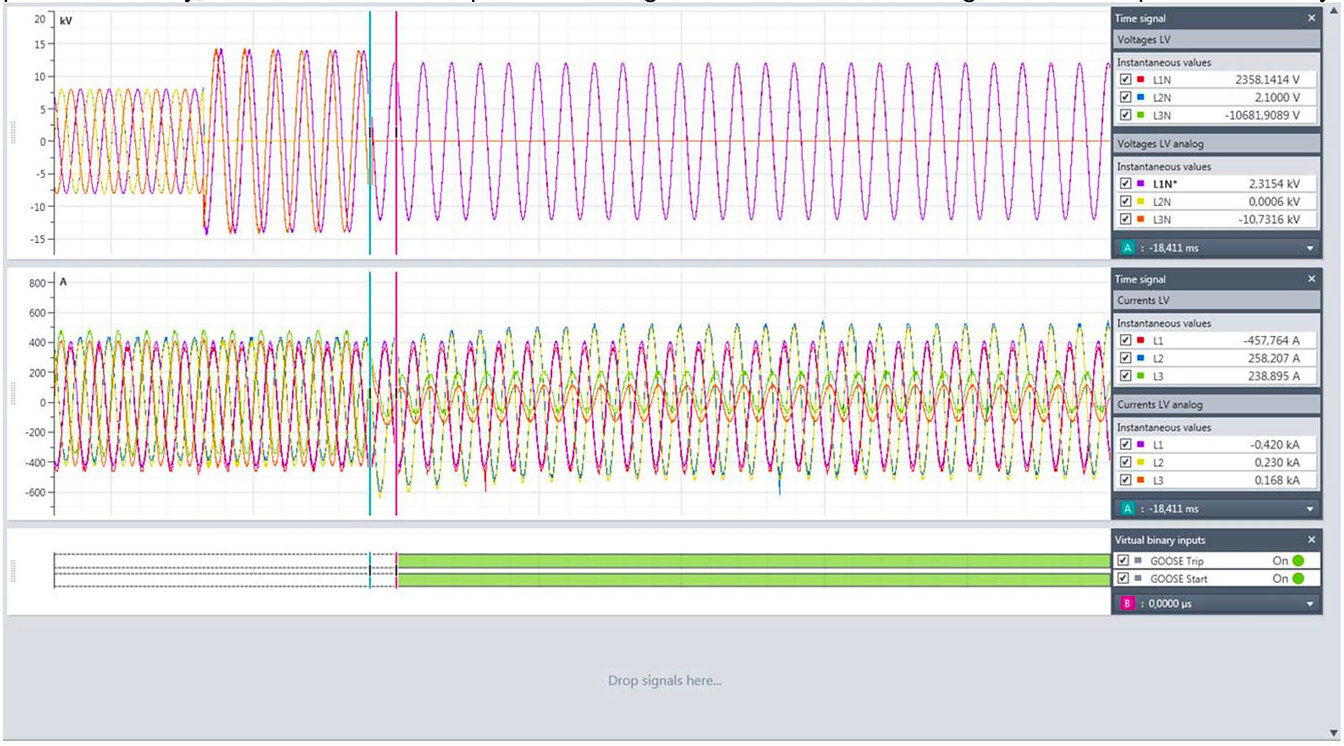
Deeper investigations of the precision can be done by zooming into the zero crossings of the signals and measure deviations between individual zero crossings with the measurement cursors. Usually no deviation between the measured analog signals and the Sampled Values signals should be seen.
By zooming into the inception of the second fault event a precise measurement of the trip time of the protection relay is possible. Again you can compare the sampled signals for analog measurements and Sampled Value streams from the merging unit of the non-conventional instrument transformers immediately.
HEARTfelt Greetings Alexander Muth